Connecting People to the Places They Want to Go by Bike
Bicycle Network Analysis
UX/UI Design
Figma
Branding
Project Management
Role
UX/UI Designer, Visual Designer + Project Manager
Client
PeopleForBikes
Tools
Introduction
Rebuild PeopleForBikes’ public-facing Bicycle Network Analysis (BNA) website that displays results from the BNA software. The Bicycle Network Analysis (BNA) is custom software that measures the quality and connectivity of bike infrastructure in more than 2,900 communities worldwide using data from OpenStreetMap, the U.S. Census, and other international population and census sources.
Project Overview
Challenges + Constraints
The BNA website has received minor upgrades over time but is largely the same as when it was constructed in 2017. Although it has worked well since then, it now faces performance issues and needs user experience improvements. Rebuilding the BNA website is a critical project for ongoing maintenance requirements and integration with the new BNA backend. The final phase of rebuilding the BNA is to rebuild the public-facing website and connect it to the backend, database, and admin page.
Site Infrastructure
Enable visitors to submit requests to the BNA from the website: Automate pipeline from user-submitted city additions and upgrades to be included on the BNA website, and later in City Ratings.
Ability to embed maps into City Ratings site: Allow limited view of data in embedded maps.
Link to OSM editing guidelines, BNA software and related documentation: Provide direct link to guidance, data and code from header.
City Search
Map-based search: Interactive map with all cities (not just first 20) that responds to filters, ability to click on city and go to city page.
Better filtering: Ability to filter by small/medium/large cities, in addition to country/state.
Better sorting: Ability to reverse sort by name (Z to A) in addition to A to Z; default to the United States at the top of the country list, since it’s a US-based tool.
City Panel
Make score panel collapsible: Allow user to see more of map, make sure map doesn’t disappear when window isn’t full screen.
Show score out of 100: Use visuals to indicate that all scores are out of 100.
Show miles of bike infrastructure: Pull miles of infrastructure from database and add to left-hand panel.
Map Interface
Mobile view improvement: The original BNA website does not display well on mobile. There are features are not functional on mobile.
General visualization: Support multiple active layers, with select layers offering toggles for controlling individual features.
Destinations visualization: Change destination to checkboxes instead of toggle (allow multiple to be viewed simultaneously), set color palette so that each destination type is unique.
Discover + Research
Our Users
The Bicycle Network Analysis website visitors range widely in their ability to interpret and use the data. While the BNA website aims to serve a general audience, it is a more detailed complement to the City Ratings website, which caters to a broad audience. As a more technical resource, it is reasonable to assume that BNA website visitors have an above-average interest in learning how to interpret the data to get the most out of the site.
PeopleForBikes 2025 City Ratings
Define
Meet Evan
Good infrastructure doesn’t just move people, it makes life better for entire communities.
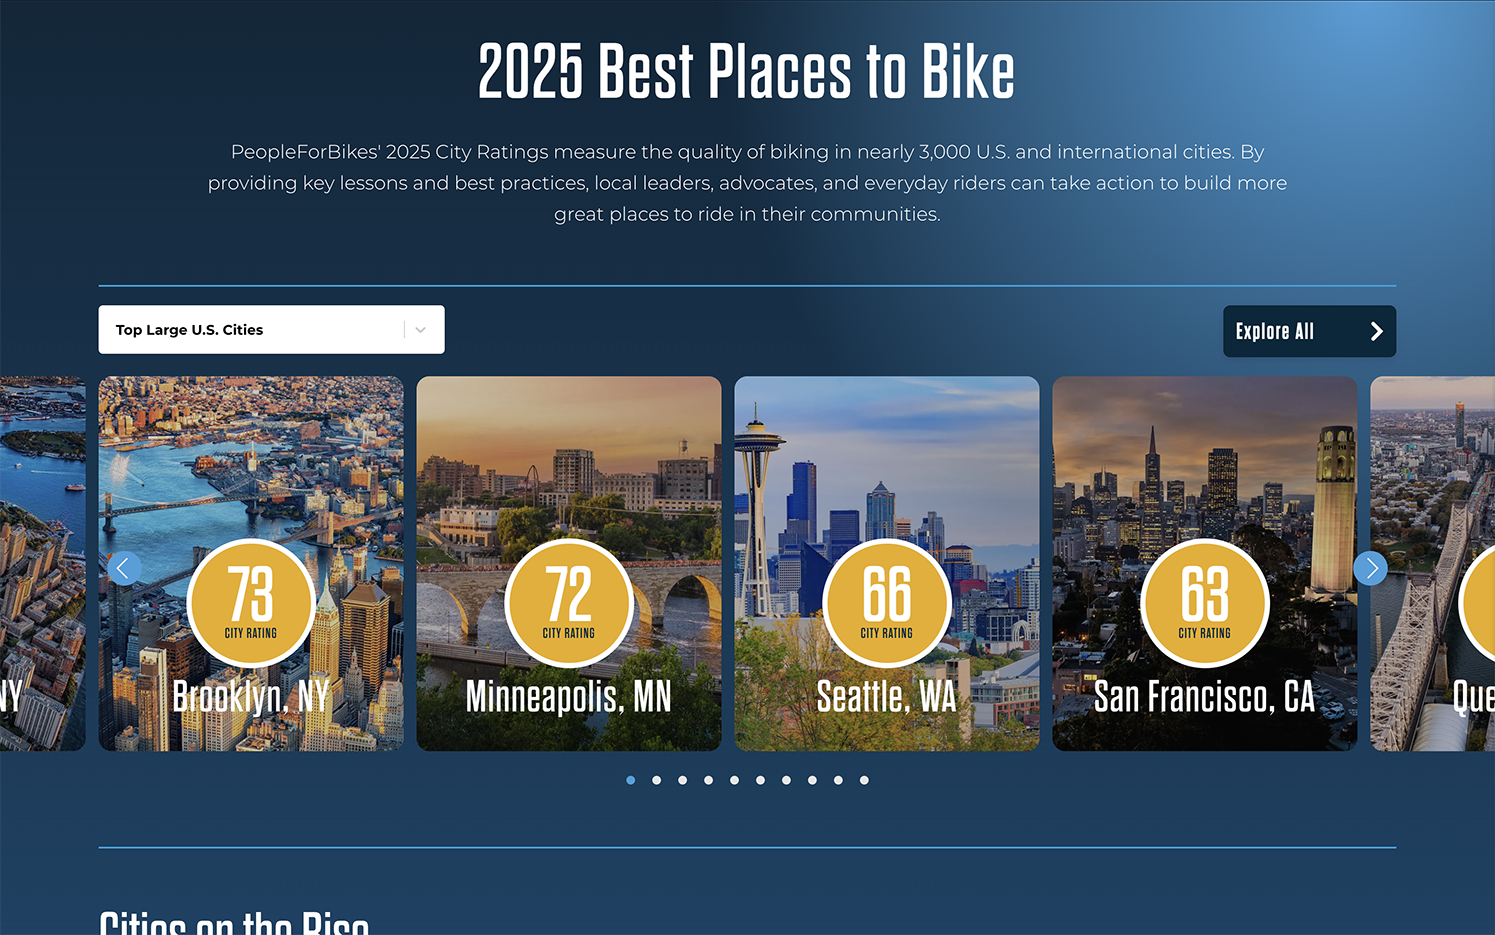
Evan is a city planner with a commitment to creating healthier, safer, and more connected communities. Living in Minneapolis, a city known for its progressive approach to cycling, has shaped both his personal and professional passions. He bikes year-round, adjusting for Minnesota’s weather with the right gear and an unwavering belief in active transportation. He owns several bikes that serve different purposes: a road bike for long weekend rides, an e-bike for commuting, and a cargo bike for school drop-offs and quick errands.
Evan
The Cycling Advocate + City Planner
👦🏻
Age | Gender
35 | Male
💍
Status
Married with kids
📍
Location
Minneapolis, MN
💼
Occupation
City Planner
Goals
Identify safe, family-friendly routes within Minneapolis to create positive biking experiences for his children.
Use data to identify gaps in cycling infrastructure and advocate for protected, connected bike networks.
Explore cities with strong cycling networks when traveling.
Frustrations
Safety Information: Wants reliable details on safe routes and protected bike lanes.
Network Connectivity: Wants connected routes that avoid car-heavy traffic.
Infrastructure Data: Needs insights to guide planning decisions.
Current BNA Website
Wireframes + Prototypes
Sketches + Revisions
When users arrive on the BNA map, they can search for any location or zoom into a specific area. Once they select a city, they can view detailed insights. Here, users can explore city-specific data, including the BNA score across six categories, and customize their view by applying filters and map layers.
City Panel
Overlays + Destination Filters
Users can choose from four map layers: Bike Infrastructure, Stress Network, Census Blocks, and Area Boundary. Testing revealed conflicts when multiple layers were selected. The final design allows only one layer to be selected at a time.
Search Panel
Design
Desktop Solution
Mobile Solution
Conclusion + Takeaways
Next Steps:
The site is currently in development.
Providing Figma files and visual assets to the team for implementation.
There will be further iterations on the homepage, map elements, search and city panels as I collaborate with our team and the developers.
This site will need to be live in Q1 of 2026, as the BNA is what powers the PeopleForBikes City Ratings program, that launches each summer.